Understanding Wildfire Exposure
This short video explains wildfire exposure and how it should or should not be used.
Wildfire Exposure Assessment
The tools and techniques applied and evaluated here are collectively called Wildfire Exposure Assessment, a process developed and published by Jennifer L. Beverly (University of Alberta) and others.
Please see the technical report on the Wildfire Exposure approach and the article published in Natural Hazards called “Spatial distribution of wildfire threat in the far north: exposure assessment in boreal communities“.
What is Wildfire Exposure?
Wildfire exposure represents the likelihood that wildfire will get to and impact a location. Exposure is increased where accumulations of elevated flammability hazard are found. Range: 0-100
What is flammability hazard?
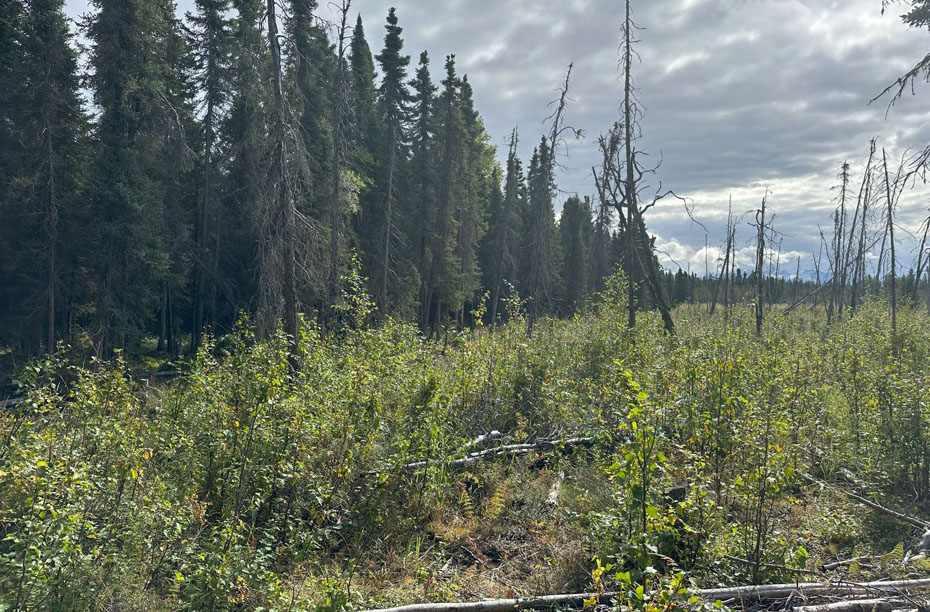
This is also called Hazardous Fuel. This is vegetation that has the potential to cause damage, loss, or harm to people, infrastructure, equipment, natural resources, or property due to its flammability (i.e. short and long-range ember spotting and intense burning). Range: 0-100
Regional Maps
Check out our regional wildfire exposure maps.
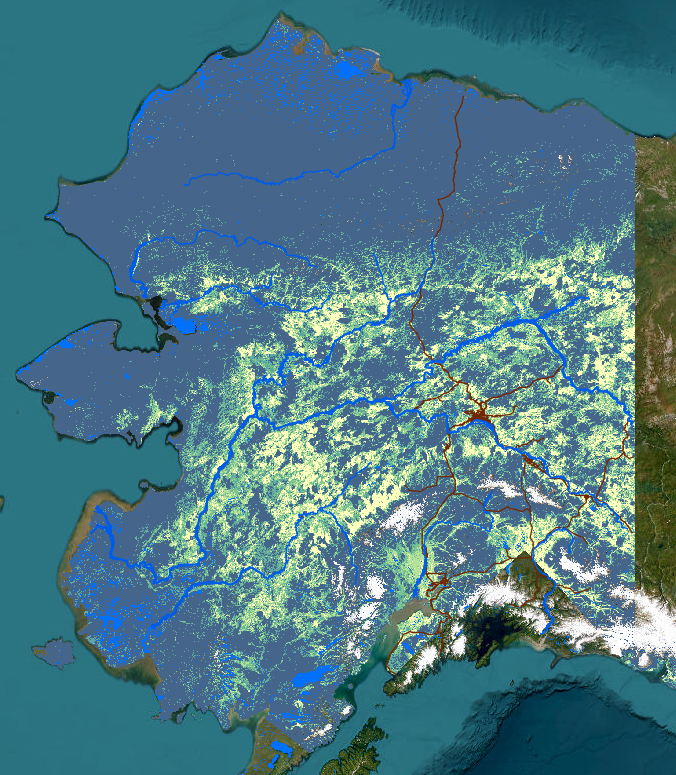
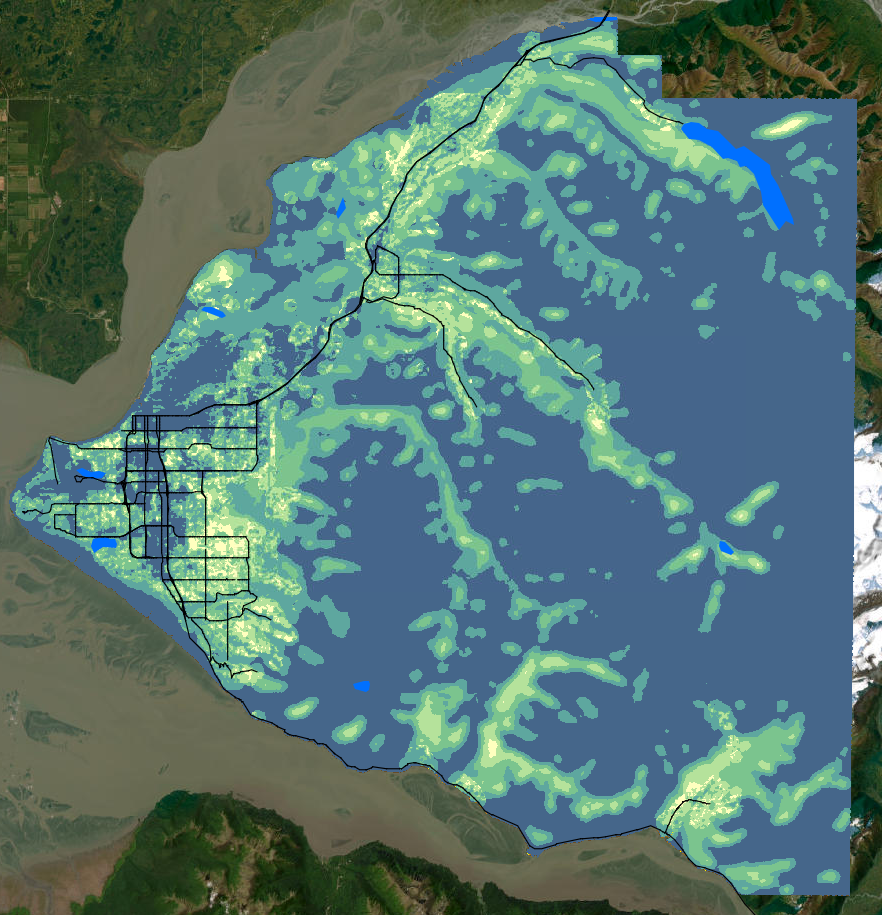
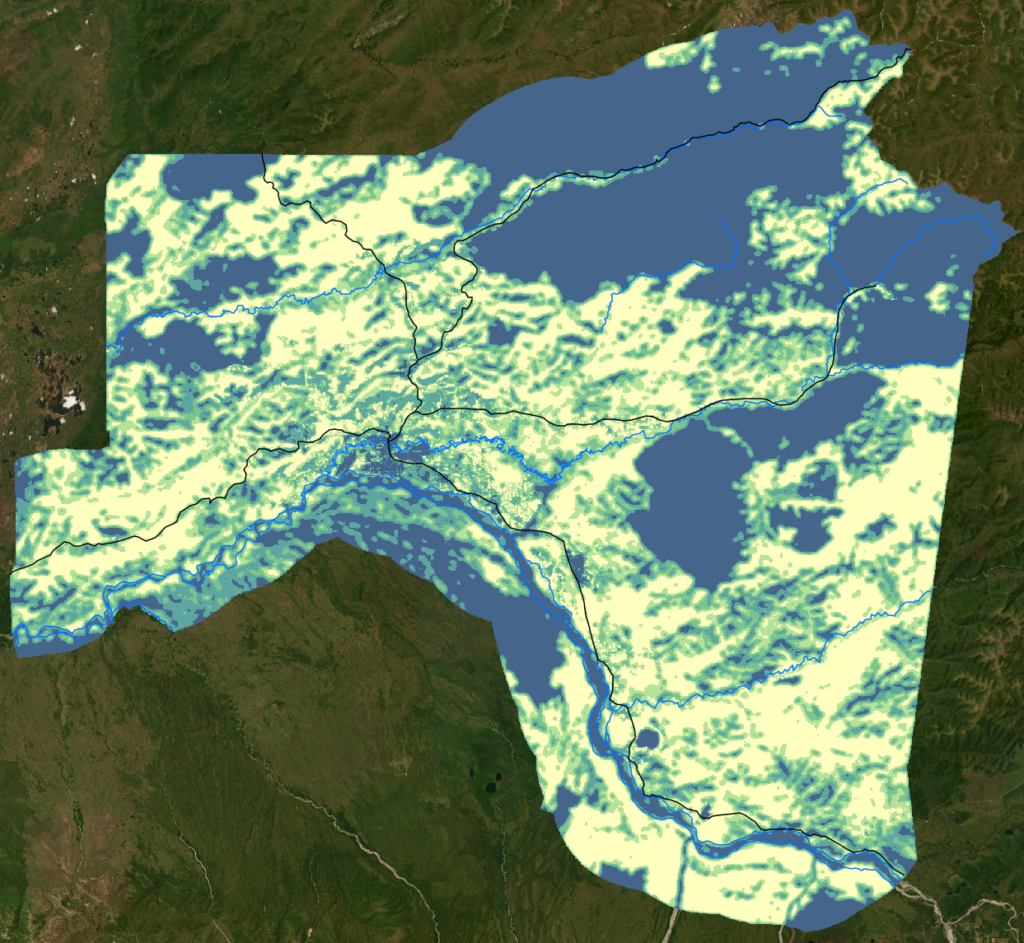
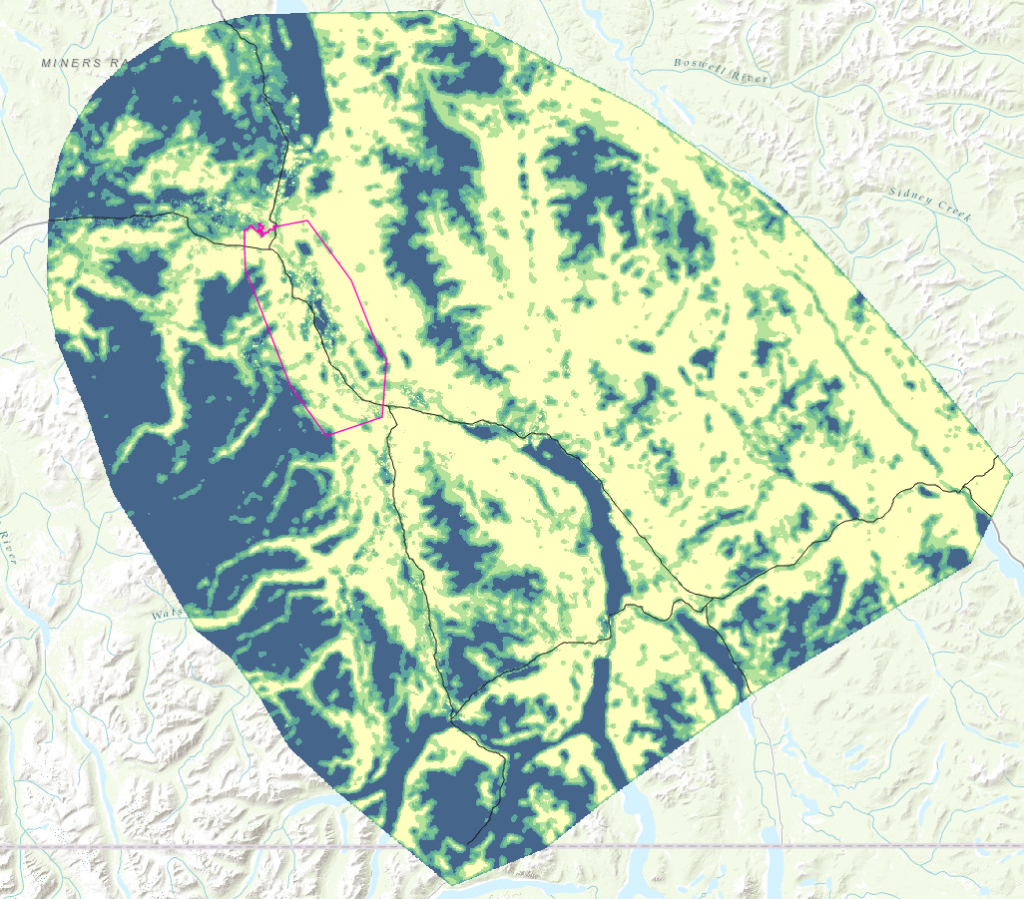
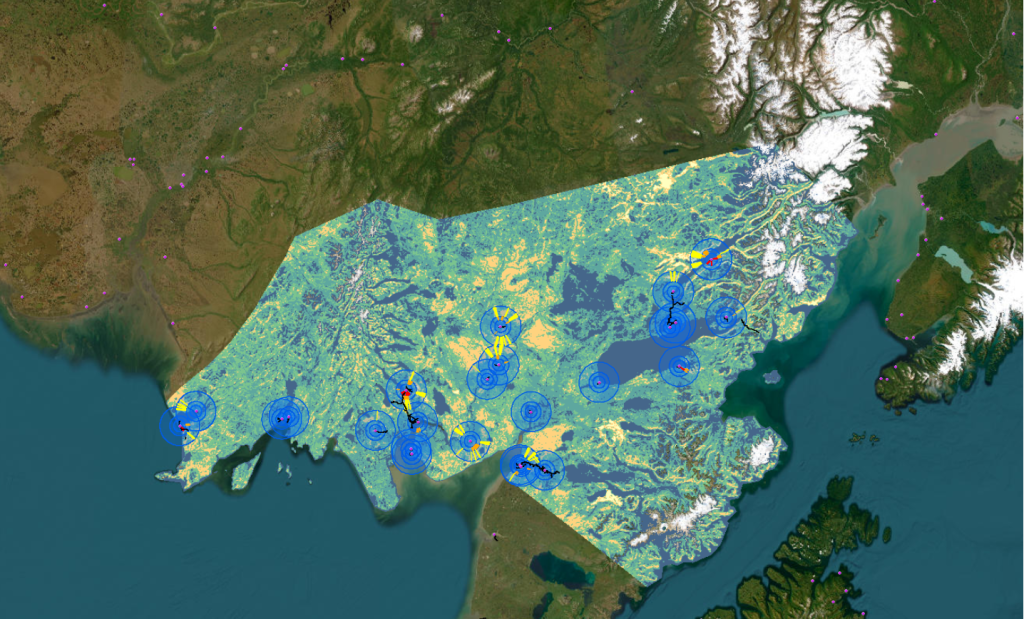
Wildfire Exposure with Tundra: Bristol Bay Region
Check out our Bristol Bay wildfire hazard and risk assessment report.
Schmidt J.I., Mair H., Larson O., and Delamere J. (2025), Wildfire Exposure and Risk Assessment for Dillingham, Aleknagik, and Igiugig, Alaska. University of Alaska.
Wildfire Exposure ArcGIS Pro Toolbox
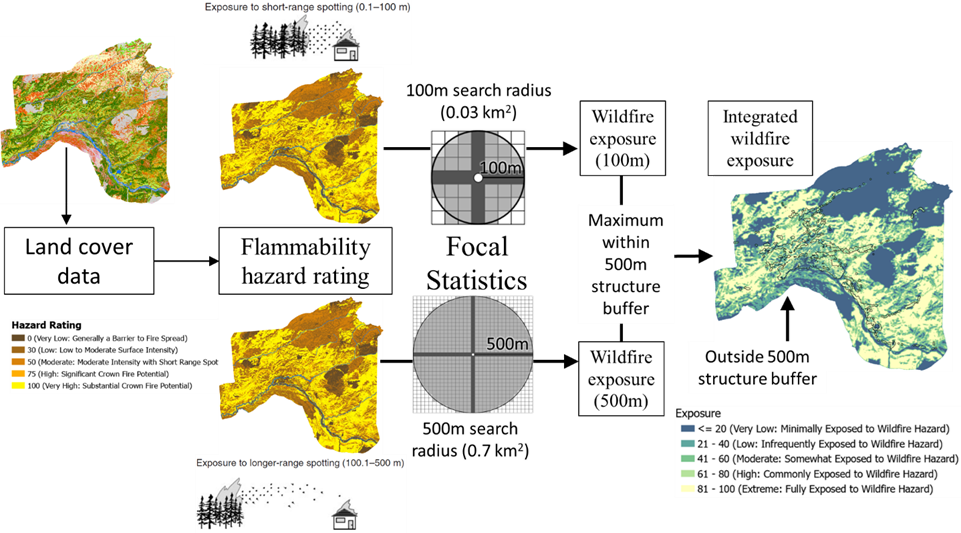
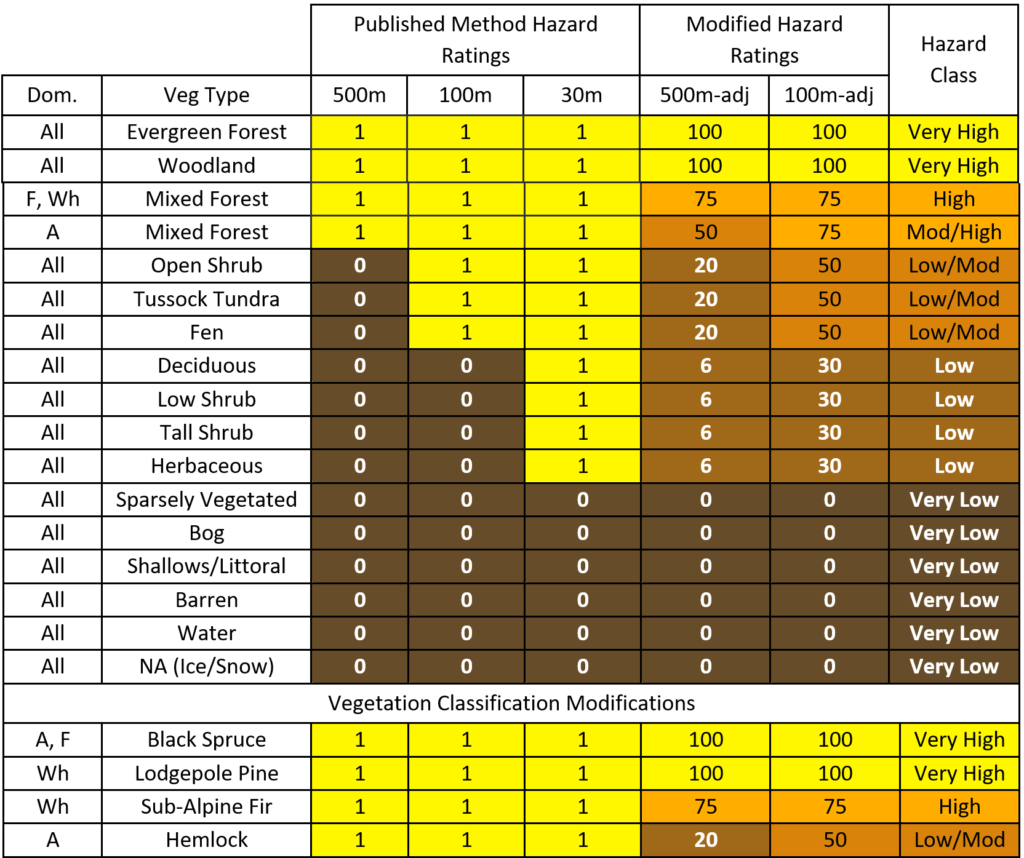
This tool is designed to allow users to calculate wildfire hazard fuels and exposure values from gridded vegetation data. It has been modified for Alaska, as shown in the figures below.
How the assessment works
The wildfire exposure assessment uses land-cover data to classify flammability hazard and calculate wildfire exposure at 100 and 500 meter distances. The figures below show the assessment process and the vegetation classifications used to adapt the methodology for Alaska.
Data Layers
The following data layers are available for download. Note, the 2024 layers contain wildfire scars through 2023.
LANDFIRE
Why is there a need for a locally developed product?
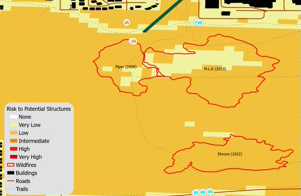
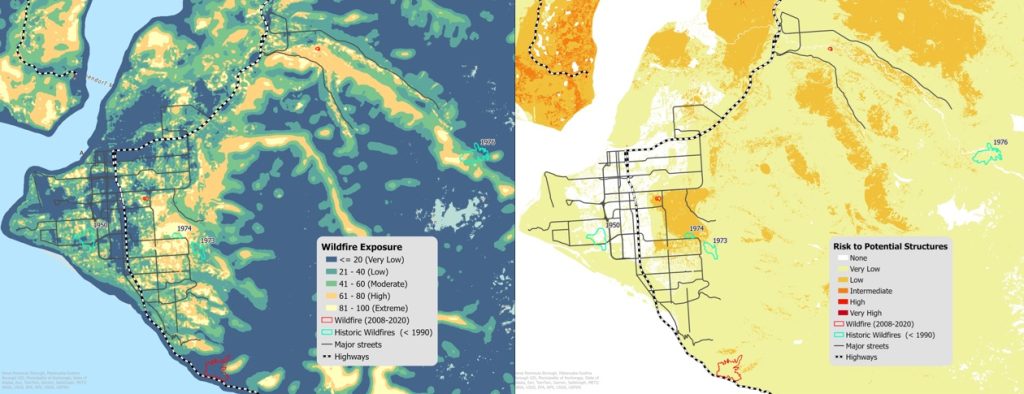
40% of Alaskans live in Anchorage. Risk to Potential Structures (RPS) assessments do not capture the elevated risk from fires within the wild-land urban interface. For example, wildfires in Southcentral Alaska do occur even though RPS classifies most of the region as very low risk.
Does your community have a pathway of high wildfire exposure?
Check out the State of Alaska’s Wildfire Directional Vulnerability Assessment app to see if your community is vulnerable. This approach is modified from Beverly, J. L., & Forbes, A. M. (2023). Assessing directional vulnerability to wildfire. Natural Hazards. doi:10.1007/s11069-023-05885-3 https://link.springer.com/article/10.1007/s11069-023-05885-3
If you do not see your community there, but want to, email me (Jen Schmidt, jischmidt@alaska.edu).
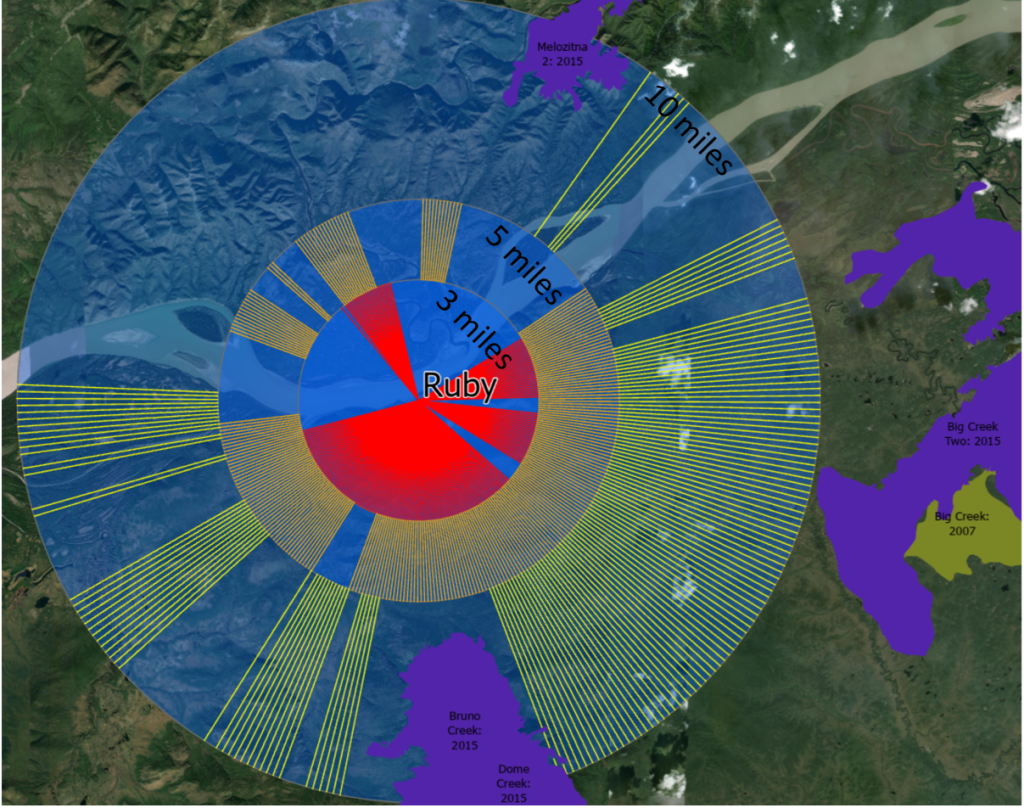
Directionality Assessment with Wildfire Exposure
- Strategic placement of fuel treatments
- 3, 5, and 10 mile buffers
- Tangents > 70% in high exposure
- Identifies vulnerable wind directions
- Good for smaller communities, but needs work for larger communities
Publications
Schmidt J.I., Ziel R., Calef M., Varvak A. (2026) Fueling fire-adapted communities through a rapid wildfire structure risk assessment. International Journal of Disaster Risk Science, 17: 351–36. https://doi.org/10.1007/s13753-026-00716-y
Schmidt, J.I., Mair H., Larson O., Delamere J. (2026) Wildfire Exposure and Risk Assessment for Dillingham, Aleknagik, and Igiugig, Alaska. University of Alaska, Anchorage. https://scholarworks.alaska.edu/handle/11122/16310
Alaska Wildfire Exposure Assessment and Fuels Planning in R10. https://drive.google.com/file/d/1hzT-aOCTfSB7AGozTH06RNEY–25gbvn/view?usp=drive_link
Ziel R., Schmidt J.I., Calef M., Varvak A. (2024) Mapping the wildfire threat to boreal communities. Available at https://www.frames.gov/catalog/69574
Schmidt J.I., Calef M., Varvak A., and Ziel R. (2024) Spatial Distribution of Wildfire Threat in the Far North: Exposure Assessment in Boreal Communities. Natural Hazards. Volume 120, pages 4901–4924. https://link.springer.com/article/10.1007/s11069-023-06365-4
Schmidt J.I., See J. (2023) Advancing Wildfire Preparedness and Planning in Anchorage Wildfire Exposure and Egress Study. http://hdl.handle.net/11122/16292
Schwoerer T., Schmidt J.I., Berman M. Bienik P., Farquharson L.M, Nicolsky D., Powell J., Roberts R., Thoman R., Ziel R. (2023) Nordic homeowners’ mitigation response to multi-hazard climate risk. Ambio, Volume 53, pages 389–405. https://link.springer.com/article/10.1007/s13280-023-01951-z
Calef M.P., Schmidt J.I., Varvak A., and Ziel R. (2023) Predicting the Unpredictable: Predicting Landcover in Boreal Alaska and the Yukon Including Succession and Wildfire Potential. Forests, 14(8), 1577. https://www.mdpi.com/1999-4907/14/8/1577
Schmidt J.I., Larson, O. (2023) Report for AK PANOCESU Collaborative Effort to Develop a Statewide Wildfire Exposure Map (L22AC00566) https://scholarworks.alaska.edu/handle/11122/16291
Partners
This work would not be possible without the support from many agencies and people. NSF support was provided by the following awards: NNA Track 1: Collaborative Research: Arctic Urban Risks and Adaptations (AURA): a co-production framework for addressing multiple changing environmental hazards. Award Number:1927563; NNA Research: Collaborative Research: Socio-ecological considerations for sustainAble Fuel treatments to Reduce wildfire Risk (SAFRR) Award Number: 212728.